
Bonds & creditYields, spreads & debt
MBA: US mortgage delinquency rate rises to 4.42% in Q3 2026 as FHA and VA foreclosure rates hit multi-year highs
The Mortgage Bankers Association's third-quarter survey shows overall delinquency edging up to 4.42%, with serious delinquency rising for a fifth straight quarter and FHA and VA foreclosure rates at their highest in nearly a decade, despite unemployment holding at 4.1%.
From the Calculated Risk article of November 20, 2026 and cited sources: The seasonally adjusted delinquency rate for one-to-four-unit mortgages rose to 4.42% in Q3 2026. [2] [3] [1]
SOURCES[2] MBA: Mortgage Delinquencies Increase in the Third Quarter… mba.org[3] HousingWire: Mortgage delinquencies rise to 4.42% in Q3 2026 housingwire.com[1] CalculatedRisk: MBA Mortgage Delinquencies Increased in Q3… calculatedrisk.substack.com
 AT Pulse research deskPublished · Updated · 5 min read · AI-assisted analysis
AI-assisted, not human-edited. Methodology Corrections Who owns this site
- What happened
- The seasonally adjusted delinquency rate for one-to-four-unit mortgages rose to 4.42% in Q3 2026. [2] [3] [1]
- Original source
- Calculated Risk article, independent perspective
- Brief by
- AT Pulse research desk AI-assisted; publisher and contact on the desk page
- When
- November 20, 2026 article published
- Covered
- Nov 21 edition
- Evidence
- 11 sources across 9 sites
- 1CalculatedRisk: MBA Mortgage Delinquencies Increased in Q3…calculatedrisk.substack.com
- 2MBA: Mortgage Delinquencies Increase in the Third Quarter…mba.org
- 3HousingWire: Mortgage delinquencies rise to 4.42% in Q3 2026housingwire.com
- 4Consumer Finance Monitor: HUD ML 2025-12consumerfinancemonitor.com
- 5HUD/FHA bulletincontent.govdelivery.com
- 6HousingWire: Mortgage delinquency Q2 2026housingwire.com
RisingHow it’s measured
Substack · 11 likes · 1 share
Reach blends public engagement (views, likes, comments, shares, stars) from the platforms where the story or its original source lives: YouTube, Hacker News, GitHub, Substack and similar. A video and the article written from its transcript share one score, taken from the video. Platforms with no data are left out rather than counted as zero, and the age of a story never lowers its score.
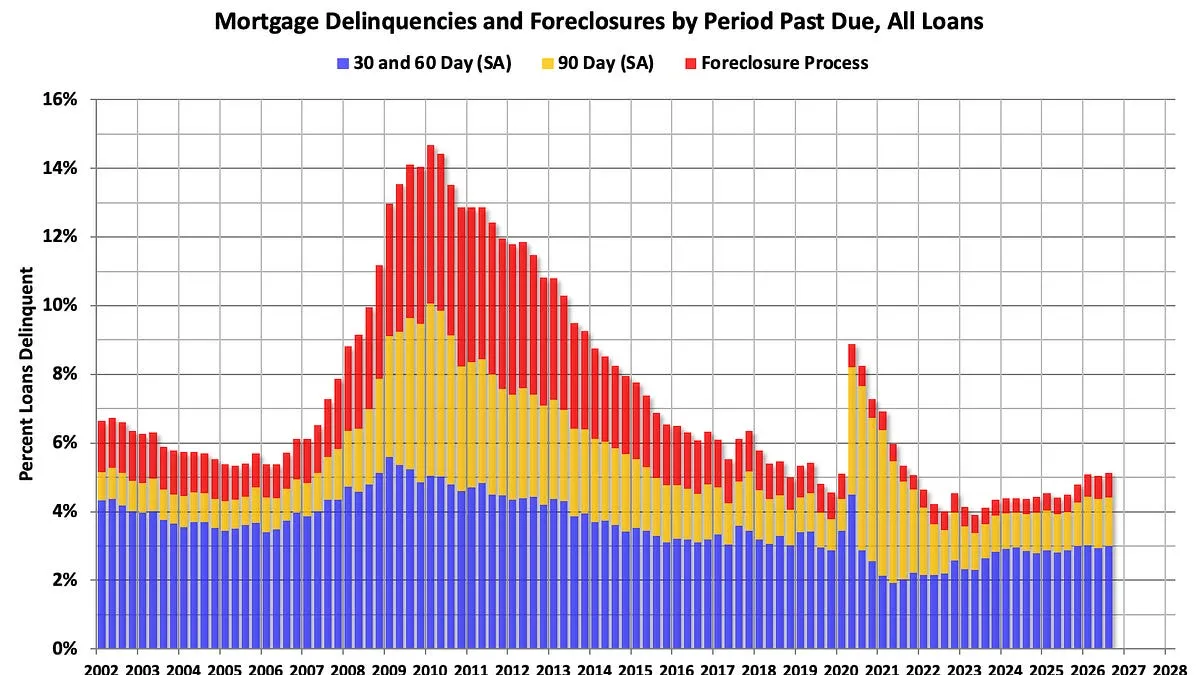
The seasonally adjusted delinquency rate for one-to-four-unit mortgages rose to 4.42% in Q3 2026. That is up 5 basis points from Q2 and 43 bp from a year earlier. The seriously delinquent rate (90+ days late or in foreclosure) reached 2.12%, its fifth straight quarterly increase and 51 bp higher than a year ago. That figure is not seasonally adjusted, so it should not be mixed with the headline rate in models. New 30-day delinquencies rose only slightly. [2] [3] [1]
The stress is concentrated in government-backed loans that are moving into foreclosure. The FHA foreclosure rate hit 1.89%, the highest since Q1 2017. The VA rate hit 1.06%, the highest since Q4 2016. FHA delinquency eased slightly to 11.74% but is up 96 bp from a year earlier. Meanwhile, overall foreclosure inventory rose from 0.67% to 0.71%, which is still low by historical standards. This pattern follows the end of FHA's COVID-era relief options on September 30, 2025. FHA now uses a permanent workout process that limits borrowers to one permanent workout every 24 months. [2] [10] [1] [6] [4] [5]
The evidence shows loans sliding into later delinquency stages and foreclosure, mostly in FHA and VA portfolios. As a result, servicers with government-loan exposure likely face more foreclosure and loss-mitigation work.
Read the full assessment
Credit modelers should track roll rates separately by loan type and origination year.
Executive brief
FHA mortgages are the clearest stress point in this report. In the third quarter of 2026 the FHA foreclosure rate reached 1.89%, the highest since Q1 2017. The VA rate of 1.06% is the highest since Q4 2016. Both figures come from the Mortgage Bankers Association's (MBA) National Delinquency Survey, released November 19, 2026 (MBA). The overall seasonally adjusted delinquency rate rose to 4.42%, up 5 basis points (bp) from Q2 and 43 bp from a year earlier (HousingWire). Unemployment is 4.1%, so this is not a labor-market shock. The stress is concentrated in government-backed loans and in loans that keep sliding into later stages of delinquency.
What changed and event timeline
FHA sets an end date for COVID-era relief
Mortgagee Letter 2025-12 set September 30, 2025 as the expiry date for FHA's COVID-19 recovery options. It also limited borrowers to one permanent workout every 24 months ().
Servicers move to the new FHA rules
Servicers stopped offering the COVID-19 options and moved to FHA's new permanent loss-mitigation waterfall, the ordered list of workout options ().
Q2 shows a small improvement
The MBA delinquency rate fell to 4.37% from 4.44% in Q1. Foreclosure inventory rose to 0.67%, and FHA delinquency stood at 11.79% ().
ICE reports September data
ICE's national delinquency rate rose 12 bp to 3.66%. Active foreclosure inventory reached its highest level since early 2019 ().
MBA releases Q3
Delinquency rose to 4.42%. The seriously delinquent rate (90+ days late or in foreclosure) reached 2.12% and has risen for five straight quarters (;).
Capabilities and access
This is a dataset, not a product release. The National Delinquency Survey covers one-to-four-unit residential mortgages and is published quarterly.
Read the full section
This is a dataset, not a product release. The National Delinquency Survey covers one-to-four-unit residential mortgages and is published quarterly. Q3 2026 figures:
- By stage: 30-day delinquency 2.25% (+4 bp q/q), 60-day 0.74% (+1 bp), 90+ day 1.43% (unchanged).
- By loan type: conventional 2.73% (+1 bp q/q), FHA 11.74% (−5 bp q/q, +96 bp y/y), VA 5.00% (+11 bp q/q).
- Foreclosure: inventory 0.71%; foreclosure starts 0.21% (+1 bp).
- States with the largest quarterly increases: Wyoming (+72 bp), then West Virginia and Louisiana (+32 bp each) (CalculatedRisk).
Technical analysis for researchers and developers
- The headline delinquency rate is seasonally adjusted, but the 2.12% seriously delinquent rate is not. Avoid mixing the two in models (CalculatedRisk).
- Foreclosures are counted separately. The delinquency rate excludes loans in foreclosure, so total distress is roughly 4.42% plus 0.71%.
- MBA and ICE are not directly comparable. ICE's monthly 3.66% uses a different method and frequency.
Read the full section
- Seasonal adjustment differs by metric. The headline delinquency rate is seasonally adjusted, but the 2.12% seriously delinquent rate is not. Avoid mixing the two in models (CalculatedRisk).
- Foreclosures are counted separately. The delinquency rate excludes loans in foreclosure, so total distress is roughly 4.42% plus 0.71%.
- MBA and ICE are not directly comparable. ICE's monthly 3.66% uses a different method and frequency. Treat the gap between the two as a measurement difference, not a contradiction (HousingWire).
- The 2020 spike is a known artifact. Forbearance loans were counted as 90+ days delinquent that year, which distorts that bucket for anyone using the history in backtests.
Claims and evidence
- Serious delinquency is up 51 bp year over year: MBA data, quoted from Marina Walsh, MBA's head of industry analysis (CalculatedRisk).
- FHA and VA foreclosure rates are at multi-year highs: MBA figures, repeated by trade press (Scotsman Guide).
- Why it is happening: Walsh cites wage growth lagging inflation, a falling savings rate, rising non-housing debt and the removal of COVID-era relief.
Read the full section
- Serious delinquency is up 51 bp year over year: MBA data, quoted from Marina Walsh, MBA's head of industry analysis (CalculatedRisk).
- FHA and VA foreclosure rates are at multi-year highs: MBA figures, repeated by trade press (Scotsman Guide). Separately, ICE's own data shows foreclosure inventory at its highest since early 2019, which points the same way (HousingWire).
- Why it is happening: Walsh cites wage growth lagging inflation, a falling savings rate, rising non-housing debt and the removal of COVID-era relief. These are MBA's interpretation; the release does not quantify them.
- Unemployment of 4.1%: confirmed by the DOL release.
Context and prior work
- FHA delinquency is down slightly from Q1 2026, when it was 11.88% (MBA Newslink), and from Q2's 11.79%.
- Over the same period, foreclosure inventory kept rising, from 0.67% to 0.71%.
- HUD said it ended the COVID-19 options because default rates on them stayed high and they were being used in ways that did not protect the FHA insurance fund (MMIF) (Consumer Finance Monitor).
Read the full section
- FHA delinquency is down slightly from Q1 2026, when it was 11.88% (MBA Newslink), and from Q2's 11.79%.
- Over the same period, foreclosure inventory kept rising, from 0.67% to 0.71%. That fits loans moving through the pipeline into foreclosure rather than borrowers recovering.
- HUD said it ended the COVID-19 options because default rates on them stayed high and they were being used in ways that did not protect the FHA insurance fund (MMIF) (Consumer Finance Monitor).
Limitations, safety and contested findings
- Is this pre-pandemic level or not? ICE puts September 2026 delinquency 34 bp below September 2019 (HousingWire).
- Is serious delinquency still rising? MBA's quarterly series shows a fifth straight increase. These are different datasets and timing.
- Foreclosure inventory is still low historically. CalculatedRisk notes that 0.71% "remains historically low."
Read the full section
- Is this pre-pandemic level or not? MBA and CalculatedRisk describe overall delinquency as "close to" pre-pandemic levels. ICE puts September 2026 delinquency 34 bp below September 2019 (HousingWire).
- Is serious delinquency still rising? ICE says serious delinquencies are down 5% from their February peak while still up 21% from a year earlier. MBA's quarterly series shows a fifth straight increase. These are different datasets and timing.
- Foreclosure inventory is still low historically. CalculatedRisk notes that 0.71% "remains historically low."
Business and practitioner implications
- Servicers and lenders with heavy FHA or VA exposure: expect more foreclosure work and higher loss-mitigation costs.
- Credit-risk modelers: the trend is moving loans into later stages, not new 30-day delinquencies.
- Interpreting the data: this is a fundamentals series. The reviewed sources tie it to no market price moves.
Read the full section
- Servicers and lenders with heavy FHA or VA exposure: expect more foreclosure work and higher loss-mitigation costs. ICE found that 2022-and-later loans made up 43% of September foreclosure starts (HousingWire).
- Credit-risk modelers: the trend is moving loans into later stages, not new 30-day delinquencies. Model roll rates (how loans move from one stage to the next) separately by loan type and origination year.
- Interpreting the data: this is a fundamentals series. The reviewed sources tie it to no market price moves.