
StocksEquities, earnings & valuations
S&P 500 Holds Up in 2026 as AI Chip Stocks Slide, While Value, Equal-Weight and the 'S&P 493' Lead
The S&P 500's worst 2026 decline was about 9%, milder than average, even as AI chip stocks sold off sharply. Beneath the calm index, value, equal-weight and non-megacap stocks led, while chip-heavy markets like Korea swung violently.
From the A Wealth of Common Sense article of November 17, 2026 and cited sources: The headline index has had a fairly mild year. [1] [2] [3]
SOURCES[1] A Strange Year in the Stock Market – A Wealth of Common… awealthofcommonsense.com[2] TKer – Valuations down more sharply than price tker.co[3] 24/7 Wall St. – Korea halted, Japan in a bear market 247wallst.com
 AT Pulse research deskPublished · Updated · 5 min read · AI-assisted analysis
AI-assisted, not human-edited. Methodology Corrections Who owns this site
- Original source
- A Wealth of Common Sense article, independent perspective
- Brief by
- AT Pulse research desk AI-assisted; publisher and contact on the desk page
- When
- November 17, 2026 article published
- Covered
- Nov 18 edition
- Evidence
- 11 sources across 11 sites
- 1A Strange Year in the Stock Market – A Wealth of Common…awealthofcommonsense.com
- 2TKer – Valuations down more sharply than pricetker.co
- 324/7 Wall St. – Korea halted, Japan in a bear market247wallst.com
- 4State Street – Magnificent 7 no longer moving as one tradessga.com
- 5CNBC – Equal-weight S&P 500 is leading the 2026 marketcnbc.com
- 6Motley Fool – Value has outperformed growth in 2026fool.com
Reach: not measured yet
The headline index has had a fairly mild year. Its deepest 2026 drawdown was about 9%, from January 27 to March 30. The average intra-year decline since 1980 is 14%. On November 5 the S&P 500 lost 4.4% in a day as the semiconductor index fell more than 12%. Carlson puts the index a little more than 6% below its high. [1] [2] [3]
Market leadership has moved beyond the AI megacaps. Value, small-cap value, the equal-weight S&P 500 and the S&P 493 have all beaten the cap-weighted index. By mid-July, the Magnificent Seven trailed the S&P 500 by 7.6%. Within the group, Alphabet was up 12.4% and Microsoft was down 21.4%. The average correlation among the seven stocks fell to 0.27, from 0.78 in mid-2025. [1] [4] [5] [6]
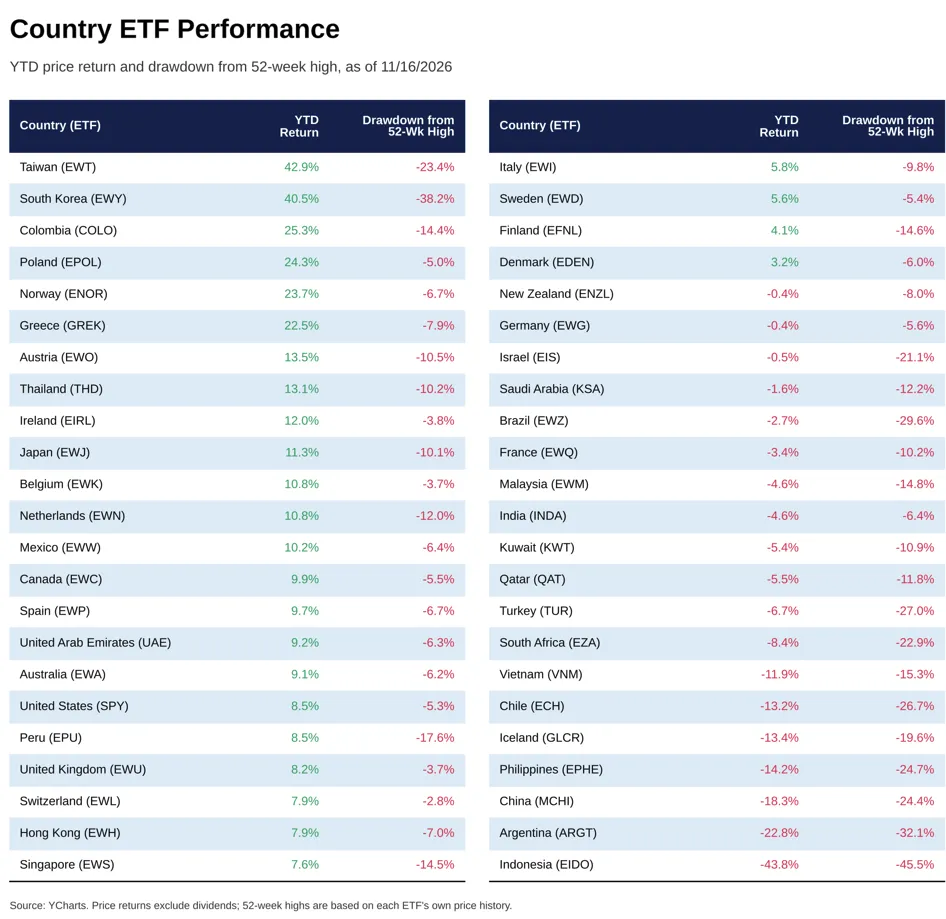
Countries whose markets lean heavily on chipmakers show the most extreme swings. Korea and Taiwan still lead year to date even though both are in bear markets. On November 6 the KOSPI fell 8.52% and trading was halted for 20 minutes. Samsung and SK hynix together make up about 43% of the Korea ETF EWY. Carlson counts 26 of 46 country ETFs down by double digits from their 52-week highs. [1] [3] [7]
Reported data show megacap correlations collapsing and leadership broadening beyond AI giants.
Read the full assessment
The implication, per State Street, is that AI exposure is no longer a single trade; returns may hinge on which firms convert AI spending into durable earnings.
Checking the last figures, then the dossier.
Executive brief
The S&P 500 has had a mild year by its own standards even though AI stocks fell hard. Its worst decline in 2026 was about 9%, between January 27 and March 30 (TKer). On November 5 the index dropped 4.4% in a single day as chip stocks sold off, and Korea's market had to pause trading the next day (24/7 Wall St.). Ben Carlson's commentary at A Wealth of Common Sense says the index sits a little more than 6% below its high. He also says value stocks, small-cap value and the "S&P 493" (the index without the Magnificent Seven) are all beating the market this year (A Wealth of Common Sense).
What changed and event timeline
The year's worst drawdown
The S&P 500 fell from a closing high of 6,978.60 to 6,343.72, about 9%. That is smaller than the 14% average intra-year decline since 1980 ().
The Magnificent Seven split apart
The group trailed the S&P 500 by 7.6% year to date. Alphabet was up 12.4% and Microsoft down 21.4% ().
Equal weight pulls ahead
The equal-weight ETF RSP led the cap-weighted index by about 3 points year to date and passed $100B in assets ().
Value leads growth
The Vanguard value ETF VTV was up 19.8% year to date against 9% for the growth ETF VUG. Micron and Texas Instruments helped lift the value side ().
AI selloff spreads to Asia
The S&P 500 fell 4.4% and the semiconductor index 12.25%. The next day Korea's KOSPI dropped 8.52% to 4,924.61 and trading halted for 20 minutes (,).
Carlson's year-to-date tally
Using data through Monday's close, Carlson counts 13 country ETFs with double-digit gains and 7 with double-digit losses. Korea and Taiwan still lead despite being in bear markets ().
Capabilities and access
There is no AI model or product release in this story. The instruments discussed are: EWY is heavily concentrated in two stocks: Samsung Electronics is 22.1% of the fund and SK hynix 21% (24/7 Wall St.). Carlson's sector valuation charts come from Duality Research (A Wealth of Common Sense).
Read the full section
There is no AI model or product release in this story. The instruments discussed are:
- the S&P 500 and the S&P 493
- value and small-cap value indexes
- the iShares Momentum ETF (MTUM)
- 46 single-country ETFs, including EWY for South Korea
EWY is heavily concentrated in two stocks: Samsung Electronics is 22.1% of the fund and SK hynix 21% (24/7 Wall St.). Carlson's sector valuation charts come from Duality Research (A Wealth of Common Sense).
Technical analysis for researchers and developers
- How the index is weighted matters. The Magnificent Seven make up about one-third of the S&P 500.
- The megacaps stopped moving together. The average three-month correlation between Magnificent Seven stocks fell to 0.27, down from 0.78 in mid-2025.
- Results depend on the yardstick. Value-versus-growth gaps differ by index provider and by cutoff date, so compare figures only on the same basis.
Read the full section
- How the index is weighted matters. The Magnificent Seven make up about one-third of the S&P 500. Equal weighting cuts their share to roughly 1.4%. That is why RSP and the S&P 493 can beat the headline index in a year when megacaps lag (CNBC, Yahoo Finance).
- The megacaps stopped moving together. The average three-month correlation between Magnificent Seven stocks fell to 0.27, down from 0.78 in mid-2025. Their forward P/E ratios ranged from 19.7x to 184.8x (State Street).
- Results depend on the yardstick. Value-versus-growth gaps differ by index provider and by cutoff date, so compare figures only on the same basis.
Claims and evidence
- Value beating growth: independently supported through September (Motley Fool).
- S&P 493 beating the Magnificent Seven: consistent with figures through July and August (State Street, CNBC).
- Spring drawdown of 9%: confirmed (TKer).
Read the full section
- Value beating growth: independently supported through September (Motley Fool).
- S&P 493 beating the Magnificent Seven: consistent with figures through July and August (State Street, CNBC).
- Spring drawdown of 9%: confirmed (TKer).
- Korea and Taiwan in bear markets: consistent with the November 6 reporting (Nikkei Asia).
- Not corroborated: MTUM's path (down about 8%, then up about 40%, now about 5% year to date) and the Duality Research valuation charts. Both rest on Carlson's charts alone (A Wealth of Common Sense).
Context and prior work
Rotation away from megacaps was already being discussed early in the year. In February, S&P Global reported wider market dispersion and equal weight taking the lead (S&P Global). Carlson adds that tech gained 660% over 10 years versus 137% for consumer staples, which helps explain why investors are re-pricing between the two (A Wealth of Common Sense).
Read the full section
Rotation away from megacaps was already being discussed early in the year. In February, S&P Global reported wider market dispersion and equal weight taking the lead (S&P Global). Also in February, MarketWatch reported that tech traded only 5.3% above its 10-year average forward P/E, against 14.4% for the whole S&P 500 (MarketWatch via Tiger). Carlson adds that tech gained 660% over 10 years versus 137% for consumer staples, which helps explain why investors are re-pricing between the two (A Wealth of Common Sense).
Limitations, safety and contested findings
- The trigger is disputed. 24/7 Wall St. points to borrowing costs and slower data-center construction (24/7 Wall St.).
- Price moves are not fundamentals. None of the reviewed sources ties the moves to reported earnings revisions.
- "Tame" depends on the comparison. Sam Ro argues valuations fell more sharply than prices did (TKer).
Read the full section
- The trigger is disputed. Nikkei Asia links the November selloff to fears of stricter AI regulation after Democrats won the midterms (Nikkei Asia). 24/7 Wall St. points to borrowing costs and slower data-center construction (24/7 Wall St.).
- Price moves are not fundamentals. None of the reviewed sources ties the moves to reported earnings revisions.
- "Tame" depends on the comparison. Carlson calls the losses tame. Sam Ro argues valuations fell more sharply than prices did (TKer).
Business and practitioner implications
This is a description of market events, not investment advice.
Read the full section
- AI exposure is not one trade anymore. Within the Magnificent Seven, 2026 returns ranged from gains to a 21% loss. State Street argues future returns will depend on which companies turn AI spending into lasting earnings (State Street).
- Single-sector concentration carries country-level risk. Markets heavy in chipmakers, like Korea and Taiwan, swing on AI capex news. Taiwan capped short sales at 3% of each stock's average daily volume from November 9 (TokenPost).
- A calm headline index can hide large swings underneath. Carlson counts 26 of 46 country ETFs in double-digit drawdowns from their 52-week highs.
This is a description of market events, not investment advice.