
EcosystemsRegions, accelerators & hubs
Harvard-led study estimates 403 US hyperscale data centres used about 1.8% of US electricity
A Nature Sustainability paper models 403 confirmed US hyperscale data centres at 68–99 TWh over May 2024–April 2025, roughly 1.8% of national electricity, with about 25.7 Mt of CO₂ and more than half their power from fossil fuels.
According to arXiv 2411.09786 (Nov 2024) [4] and arXiv 2606.05420 (Jun 2026) [6]: Harvard-led study estimates 403 US hyperscale data centres used about 1.8% of US electricity.
SOURCES[4] arXiv 2411.09786 arxiv.org[6] arXiv 2606.05420 (abstract) arxiv.org
 AT Pulse research deskPublished · Updated · 5 min read · AI-assisted analysis
AI-assisted, not human-edited. Methodology Corrections Who owns this site
- What happened
- The estimated 68–99 TWh (central estimate about 82 TWh) is roughly what Michigan or Indiana uses in a year. [2] [3] [5] [9] [10]
- Original source
- Upstarts Media article, independent perspective
- Brief by
- AT Pulse research desk AI-assisted; publisher and contact on the desk page
- When
- November 16, 2026 article published
- Covered
- Nov 17 edition
- Evidence
- 11 sources across 9 sites
StrongHow it’s measured
Substack · 10 likes · 7 comments
Reach blends public engagement (views, likes, comments, shares, stars) from the platforms where the story or its original source lives: YouTube, Hacker News, GitHub, Substack and similar. A video and the article written from its transcript share one score, taken from the video. Platforms with no data are left out rather than counted as zero, and the age of a story never lowers its score.
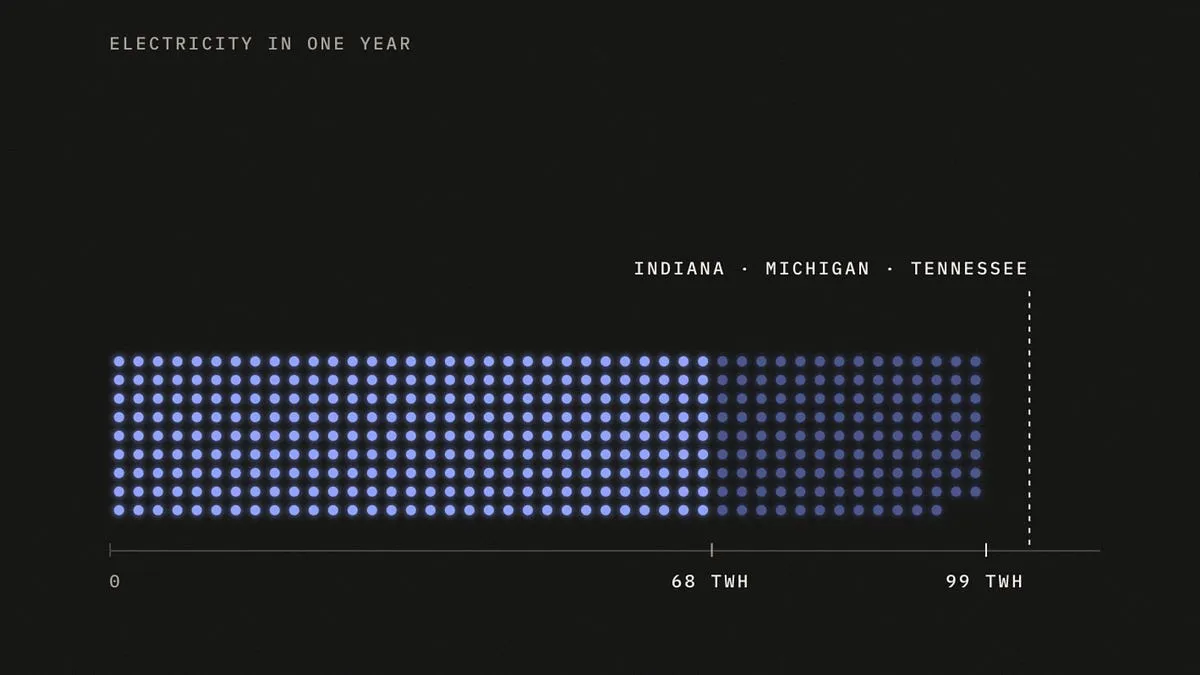
The estimated 68–99 TWh (central estimate about 82 TWh) is roughly what Michigan or Indiana uses in a year. The researchers derived it from each site's capacity multiplied by an assumed load factor of 0.48–0.70, because operators do not disclose metered consumption. The figure covers hyperscale sites only. It is not directly comparable with Berkeley Lab's estimate of 176 TWh for all US data centres in 2023. [2] [3] [5] [9] [10]
Location drives most of the carbon outcome. Virginia, Oregon, Ohio and Iowa account for more than half the electricity, and Virginia alone has 142 sites using about 21.4 TWh. The same amount of electricity emits about seven times more CO₂ on Wyoming's grid than on Oregon's. [3] [9]
The carbon figures changed sharply between versions of the paper. The preprint put emissions at 37–54 Mt and carbon intensity at 545 g CO₂/kWh, about 48% above the grid average. Coverage of the published paper reports about 25.7 Mt and 314 g/kWh, roughly 10% below average. Sources also disagree on the renewable and nuclear shares of the power mix. [1] [2] [6] [9] [10]
modelled estimates show that grid mix and siting, more than building size, determine data-centre emissions. Implication: builders, power buyers and investors face location-driven carbon exposure and local opposition.
Read the full assessment
Metered, hourly disclosure by operators could narrow the uncertainty.
The draft is ready, built from the paper's preprint, Harvard's release and independent coverage. I'm now cross-checking the figures that differ between sources.
Executive brief
A Harvard-led study in Nature Sustainability (published 16 November 2026) estimates that just 403 US hyperscale data centres used 68–99 TWh of electricity in one year. That is about 1.8% of all US electricity, similar to what Michigan or Indiana uses. Their central estimate of 25.7 Mt of CO₂ is about what Denmark emits in a year (Harvard Chan School; TIME). About 54% of the power came from fossil fuels. The researchers modelled these figures; they did not meter them. The data ends in April 2025, so it misses the newest AI campuses.
What changed and event timeline
Apr 2025: Study window
The paper covers a 12 month operating period for 403 confirmed hyperscale sites. It does not include later projects such as xAI's Colossus ().
Same team's broader preprint
Guidi, Dominici and colleagues looked at 2,132 US data centres. They put them at more than 4% of US electricity and over 105 Mt CO₂e, with carbon intensity 48% above the national average ().
The government's (DOE/LBNL) baseline
Lawrence Berkeley National Laboratory estimated that all US data centres used 176 TWh in 2023 (4.4% of US electricity). It projected 325–580 TWh by 2028 ().
Hyperscale preprint posted
The arXiv version reported 37–54 Mt CO₂ and a carbon intensity of 545 g CO₂/kWh ().
Peer-reviewed publication
The paper appeared in after three rounds of review. The team also launched the explorer site ().
Capabilities and access
- Paper: "Assessing the carbon emissions and energy consumption of US hyperscale data centres," Nature Sustainability (Nature).
- Code: open source at github.com/gianguidi/hyperscale-emissions, with synthetic and aggregated datasets (arXiv HTML).
- Restricted data: the facility-level data comes from a commercial vendor under a data-use agreement and is not public.
Read the full section
- Paper: "Assessing the carbon emissions and energy consumption of US hyperscale data centres," Nature Sustainability (Nature).
- Code: open source at github.com/gianguidi/hyperscale-emissions, with synthetic and aggregated datasets (arXiv HTML).
- Restricted data: the facility-level data comes from a commercial vendor under a data-use agreement and is not public.
- Explorer site: currently a preview with demo data for Loudoun County, Virginia (Never Just A Building).
Technical analysis for researchers and developers
- Site list: 675 candidate sites from the vendor Baxtel. 403 were confirmed using OpenStreetMap building outlines and Esri aerial imagery.
- Missing capacity: six sites lacked capacity data. A gradient-boosted regression filled them in (R² = 0.807).
- Energy formula: capacity × 8,760 hours × a facility-load factor u.
Read the full section
Method, per the preprint:
- Site list: 675 candidate sites from the vendor Baxtel. 403 were confirmed using OpenStreetMap building outlines and Esri aerial imagery.
- Missing capacity: six sites lacked capacity data. A gradient-boosted regression filled them in (R² = 0.807).
- Energy formula: capacity × 8,760 hours × a facility-load factor u. Values of u from 0.48 to 0.70 give 68–99 TWh; the central case is 0.58.
- Emissions: each site is assigned to its regional grid operator ("balancing authority"). Emissions are spread across that region's power plants by generation share, using EPA eGRID2023 data.
- Not covered: green-power contracts (PPAs), on-site generation, hour-by-hour carbon matching, and any split between AI and other workloads.
- Method choice: the study measures each site's share of the average regional grid ("attributional"). It does not model the extra plants a new site causes to run (marginal or "consequential" emissions), which matters for siting decisions.
Claims and evidence
- Electricity: 68–99 TWh, central 82 TWh, about 1.8% of US use (Harvard; Yahoo/Tom's Hardware).
- Power mix: 53.9% fossil (38.2% gas, 15.2% coal), 25.3% renewables, 20.9% nuclear (arXiv HTML). Upstarts quotes 7% renewables and 33% nuclear instead (Upstarts).
- Carbon intensity: the published coverage gives 314 g CO₂/kWh, about 10% below the grid average (Yahoo).
Read the full section
- Electricity: 68–99 TWh, central 82 TWh, about 1.8% of US use (Harvard; Yahoo/Tom's Hardware).
- Power mix: 53.9% fossil (38.2% gas, 15.2% coal), 25.3% renewables, 20.9% nuclear (arXiv HTML). Upstarts quotes 7% renewables and 33% nuclear instead (Upstarts). The two sets of figures conflict.
- Carbon intensity: the published coverage gives 314 g CO₂/kWh, about 10% below the grid average (Yahoo). The preprint said 545 g/kWh, 48% above average (arXiv). The headline CO₂ figure moved a lot between versions.
- Concentration: Virginia, Oregon, Ohio and Iowa account for more than half the electricity. Virginia alone has 142 sites using about 21.4 TWh (TIME).
Context and prior work
- 2018 baseline: Siddik et al. (2021) estimated 10.5 Mt CO₂ for 2018.
- Scope vs. LBNL: LBNL's 176 TWh covers all US data centres in 2023 (Berkeley Lab). The Harvard figure covers hyperscale sites only.
- Origin: the project was inspired by a 2023 New York Times investigation of Bitcoin miners (Upstarts).
Read the full section
- 2018 baseline: Siddik et al. (2021) estimated 10.5 Mt CO₂ for 2018. That study used a different sample and methods, so the "2–3x" growth comparison is approximate (arXiv HTML; Upstarts).
- Scope vs. LBNL: LBNL's 176 TWh covers all US data centres in 2023 (Berkeley Lab). The Harvard figure covers hyperscale sites only.
- Origin: the project was inspired by a 2023 New York Times investigation of Bitcoin miners (Upstarts).
Limitations, safety and contested findings
- Modelled, not metered: operators don't disclose consumption. Outside experts told AP the modelling was reasonable given that gap.
- Possible undercount: not every hyperscale site is included, and on-site generation is excluded.
- Health not measured: the study did not directly measure health effects (Harvard).
Read the full section
- Modelled, not metered: operators don't disclose consumption. Outside experts told AP the modelling was reasonable given that gap. Caleb Max of the National AI Association argued the fears "may be overblown" (The Next Web).
- Possible undercount: not every hyperscale site is included, and on-site generation is excluded. The authors say the 2026 footprint could already be "substantially larger" (Yahoo).
- Health not measured: the study did not directly measure health effects (Harvard).
Business and practitioner implications
- Location drives emissions: for the same electricity, the Wyoming grid mix emits about seven times more CO₂ than Oregon's (TIME).
- Local opposition is real: TIME reports 40 of 41 November 2026 ballot measures limited data-centre development (TIME).
- No funding news here: Upstarts mentions compute-market and energy startups (SF Compute, Valar Atomics, Build Inc.).
Read the full section
- Location drives emissions: for the same electricity, the Wyoming grid mix emits about seven times more CO₂ than Oregon's (TIME). Where you build and how you buy power matter more than the size of the building.
- Local opposition is real: TIME reports 40 of 41 November 2026 ballot measures limited data-centre development (TIME).
- No funding news here: Upstarts mentions compute-market and energy startups (SF Compute, Valar Atomics, Build Inc.). The article reports no rounds, valuations or investors, so there is nothing to verify (Upstarts).
- Disclosure gap: operators that publish metered, hour-by-hour energy data would undercut estimates built on assumed load factors.