
StocksEquities, earnings & valuations
Ben Carlson tallies the S&P 500's losing stretches: 26 down years since the late 1920s and recoveries that took up to four years
Ben Carlson's Nov. 12 post, the counterpart to his October look at 15.7% annual S&P 500 returns over 15 years, catalogs the market's losing stretches: decade-plus flat periods, 26 down years since the late 1920s, and recoveries taking years.
From the A Wealth of Common Sense article of November 12, 2026 and cited sources: Stocks have gone nowhere for long stretches. [1] [2]
SOURCES[1] The Bear Markets — A Wealth of Common Sense awealthofcommonsense.com[2] Linked video: The Bear Markets youtube.com
 AT Pulse research deskPublished · Updated · 5 min read · AI-assisted analysis
AI-assisted, not human-edited. Methodology Corrections Who owns this site
- Original source
- A Wealth of Common Sense article, independent perspective
- Brief by
- AT Pulse research desk AI-assisted; publisher and contact on the desk page
- When
- November 12, 2026 article published
- Covered
- Nov 15 edition
- Evidence
- 10 sources across 9 sites
- 1The Bear Markets — A Wealth of Common Senseawealthofcommonsense.com
- 2Linked video: The Bear Marketsyoutube.com
- 315 Year Stock Market Returnsawealthofcommonsense.com
- 4Benzinga: Dow 1,000benzinga.com
- 5Fox Business: Nasdaq 100 surpasses dot-com peakfoxbusiness.com
- 6S&P 500 annual returns (Damodaran data), eco3mineco3min.fr
RisingHow it’s measured
YouTube video · 16.4K views · 218 likes
Reach blends public engagement (views, likes, comments, shares, stars) from the platforms where the story or its original source lives: YouTube, Hacker News, GitHub, Substack and similar. A video and the article written from its transcript share one score, taken from the video. Platforms with no data are left out rather than counted as zero, and the age of a story never lowers its score.
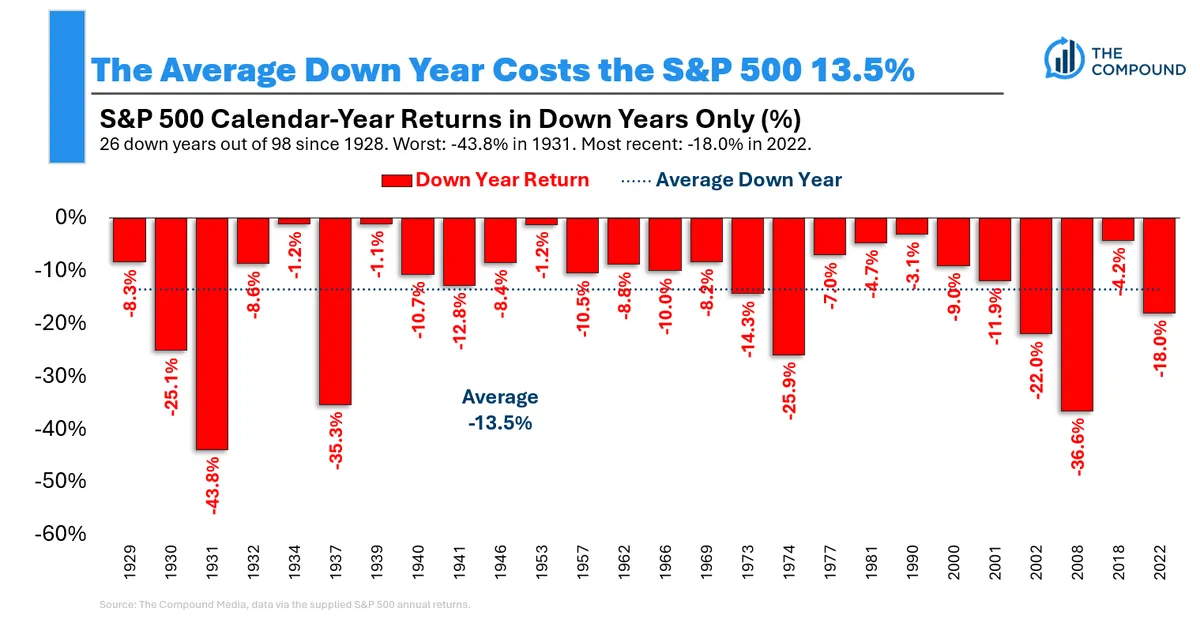
Stocks have gone nowhere for long stretches. The Dow was roughly flat on a price basis from 1966 to 1982, and worse after inflation. The S&P 500 gained only about 2.5% in total, dividends included, from March 2000 to fall 2011. From 1929 to 1941 the market fell in 9 of 13 years, for a 35% total loss. [1] [2]
Rolling five-year S&P 500 returns since 1926 have been positive 89% of the time, but those windows overlap. There were still ten separate negative five-year stretches, including a drop of about 30% around the 2008 crisis. Down years came in 26 of 98 years and averaged −13.5%. The worst was 1931 at about −44%. These tallies match Damodaran's annual return series and an independent count of 72 up and 26 down years. [1] [2] [6] [7]
The historical figures are well documented. The hosts draw the lesson that investors, especially holders of leveraged ETFs, should plan for slow, non-V-shaped declines rather than assume quick rebounds.
Executive brief
Over rolling five-year windows since 1926, the S&P 500 has been positive 89% of the time. It has still had ten separate negative five-year stretches, including a fall of about 30% around the 2008 financial crisis (Carlson; video, 07:56). Ben Carlson's November 12 commentary answers a reader who asked for the losing side of his October post on 15-year returns, which showed the S&P 500 compounding at 15.7% a year (15 Year Stock Market Returns). His point is that long, flat or losing stretches happen and will happen again. This is historical commentary, not new market data.
What changed and event timeline
Dow closes above 1,000 for the first time
It closed at 1,003.16, then fell back below 1,000 in January 1973. Carlson counts 1966–1982 as 16 flat years on a price basis ().
Nasdaq 100 regains its dot-com peak
It closed near 4,706, just above its March 27, 2000 close of 4,704.73. The intraday record from March 2000 still stood ().
Carlson publishes the bull-side data
Through September 2026 the S&P 500 returned 15.7% a year over 15 years and 15.3% over 10, both well above its long-run average of about 10% ().
"The Bear Markets" appears
The post covers the 1929–41 losses, 2000–11, the Nasdaq 100, down years and post-war bear markets (). The linked Ask the Compound episode, recorded around Veterans Day, opens with this question ().
Capabilities and access
There is no product or model here. The post is free commentary paired with a 45-minute episode of Ask the Compound with Carlson, Duncan Hill and Bill Sweet of Ritholtz Wealth Management. The video transcript is automatic captions and contains errors.
Read the full section
There is no product or model here. The post is free commentary paired with a 45-minute episode of Ask the Compound with Carlson, Duncan Hill and Bill Sweet of Ritholtz Wealth Management. Besides bear markets, the episode covers an inherited annuity paying $50,000 a year, whether very wealthy clients need financial plans, emergency funds, Trump accounts for children and how to take less portfolio risk (video). The video transcript is automatic captions and contains errors.
Technical analysis for researchers and developers
The headline numbers depend on how each is measured:
Read the full section
The headline numbers depend on how each is measured:
- Price vs total return: The Dow's flat 1966–82 run is price only. Carlson says it was somewhat better with dividends and much worse after inflation (06:08). The 2000–2011 S&P figure includes dividends: about 2.5% in total (06:49).
- Rolling windows: Five-year windows overlap, so "89% positive" is not 89% of independent periods.
- How recovery is counted: "Breakeven" can be measured from the peak or from the trough, on price or total return. Choosing differently changes the answer by years (see Limitations).
- Nominal returns: The 1931 loss of 43.84% came while consumer prices fell about 9%, which softens the real loss (Damodaran data via eco3min).
Claims and evidence
Read the full section
- 1929–1941: the market fell in 9 of 13 years, for a total loss of 35% (Carlson).
- 26 down years out of 98, averaging −13.5%. The worst was 1931 at about −44%; 2008 was −37% (09:01). This matches Damodaran's NYU series (eco3min) and an independent 72-up/26-down tally for 1928–2025 (Traders Union).
- Breakeven times: 46 months after 1973–74, 48 after the dot-com crash, 37 after the 2008 crisis. The 2022 loss took about two years from the January 2022 peak (09:31).
- 55% of US adults say they have three months of emergency savings (Federal Reserve SHED 2025). This matches Carlson's trivia question in the episode (29:06).
Context and prior work
This post is the counterpart to Carlson's October piece. He says his book Risk & Reward uses the same structure, pairing each chapter of bad news with one on managing that risk (Carlson). The Nasdaq Composite passed its 2000 record in April 2015 (UPI). The Nasdaq 100 did not close above its 2000 peak until November (Fox Business).
Limitations, safety and contested findings
- Lambda Finance measures from the trough on price and gets 69 months after 1973–74, 56 after 2000–02 and 49 after 2007–09 (Lambda Finance).
- The post is inconsistent with the episode. The episode calls 37 months the breakeven (09:57). The extracted text does not state the method.
- The post's charts and tables were not in the reviewed sources, so individual figures rest on the episode's narration.
Read the full section
- Recovery times disagree across sources. Lambda Finance measures from the trough on price and gets 69 months after 1973–74, 56 after 2000–02 and 49 after 2007–09 (Lambda Finance). Carlson's figures are 46, 48 and 37.
- The post is inconsistent with the episode. The post's prose describes the 2008 crisis as 17 months to the bottom plus 20 more to new highs. The episode calls 37 months the breakeven (09:57). The extracted text does not state the method.
- Missing tables. The post's charts and tables were not in the reviewed sources, so individual figures rest on the episode's narration.
Business and practitioner implications
These are the hosts' views as described, not recommendations.
Read the full section
- For advisers: Sweet says Ritholtz CEO Josh Brown told the firm's planners to review client plans given the bond-market shift and where the market cycle stands (38:24).
- On leveraged ETFs: Carlson warns that in a slow, non-V-shaped bear market, leveraged ETFs could fall 80–90% (10:52).
- For analysts and product builders: When showing historical drawdowns, state the index, whether dividends are included, whether figures are nominal or real, and when the recovery clock starts.
These are the hosts' views as described, not recommendations.
The source trail.
Sources (10)
The Bear Markets — A Wealth of Common Sense
awealthofcommonsense.comLinked video: The Bear Markets
linked video auto captions
www.youtube.com