
MacroGrowth, inflation & jobs
US existing-home sales fall 5.5% in October to 3.75 million pace, lowest since 2010
US existing-home sales fell 5.5% in October to a 3.75 million annual pace, the slowest since August 2010, as 30-year mortgage rates averaged above 7%. Inventory is rising relative to sales, while the direction of prices remains disputed.
From the Calculated Risk article of November 12, 2026 and cited sources: Existing-home sales dropped to a 3.75 million seasonally adjusted annual rate in October. [2] [1] [6]
SOURCES[2] NAR: Existing-Home Sales Decreased 5.5% in October nar.realtor[1] CalculatedRisk: NAR Existing-Home Sales 3.75 million SAAR… calculatedrisk.substack.com[6] RISMedia: October Existing-Home Sales Sink to 16-Year Low rismedia.com
 AT Pulse research deskPublished · Updated · 4 min read · AI-assisted analysis
AI-assisted, not human-edited. Methodology Corrections Who owns this site
- What happened
- Existing-home sales dropped to a 3.75 million seasonally adjusted annual rate in October. [2] [1] [6]
- Original source
- Calculated Risk article, independent perspective
- Brief by
- AT Pulse research desk AI-assisted; publisher and contact on the desk page
- When
- November 12, 2026 article published
- Covered
- Nov 13 edition
- Evidence
- 7 sources across 6 sites
- 1CalculatedRisk: NAR Existing-Home Sales 3.75 million SAAR…calculatedrisk.substack.com
- 2NAR: Existing-Home Sales Decreased 5.5% in Octobernar.realtor
- 3News4JAX/AP: 30-year rate dips to 7.24%news4jax.com
- 4The Mortgage Reports: Freddie Mac weekly averages, Oct 29…themortgagereports.com
- 5NAR: Pending Home Sales Decreased 7.3% in Septembernar.realtor
- 6RISMedia: October Existing-Home Sales Sink to 16-Year Lowrismedia.com
QuietHow it’s measured
Substack · 10 likes
Reach blends public engagement (views, likes, comments, shares, stars) from the platforms where the story or its original source lives: YouTube, Hacker News, GitHub, Substack and similar. A video and the article written from its transcript share one score, taken from the video. Platforms with no data are left out rather than counted as zero, and the age of a story never lowers its score.
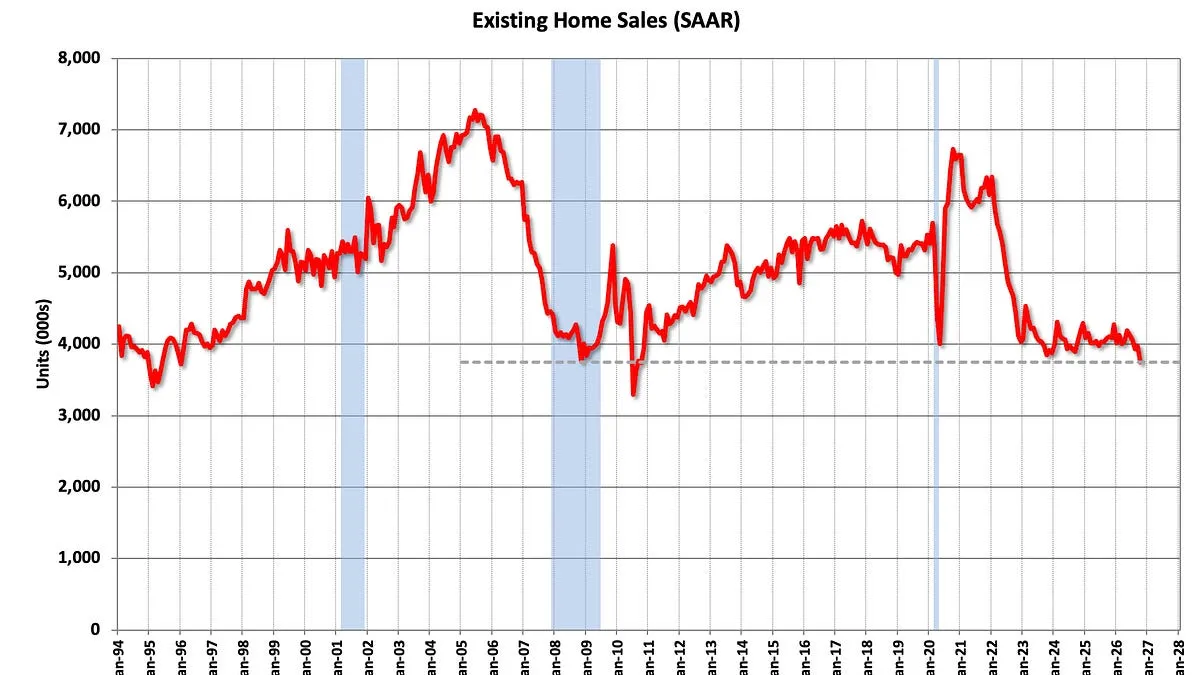
Existing-home sales dropped to a 3.75 million seasonally adjusted annual rate in October. That is down 5.5% from September and 8.8% from a year earlier, and it is the weakest pace since August 2010, when sales were 3.68 million. The West fell hardest, down 14.5% year over year. [2] [1] [6]
NAR attributes the slump mainly to 30-year mortgage rates, which averaged 7.33% in October versus 6.25% a year earlier. Freddie Mac's weekly average peaked at 7.40% in mid-October. September's 7.3% drop in pending contracts foreshadowed the October decline, and Zonda expects November and December closings to reflect buyers pulling back at those rate levels. [2] [4] [5] [7]
Price signals conflict. NAR's median sale price rose 0.4% year over year to $416,700. HousingWire's weekly data shows the single-family median down 3.2% to $400,000. Both are medians that shift with the mix of homes sold, so neither tracks like-for-like price changes. [2] [7] [1]
Months of supply rose to 5.1, above 3.9 in October 2019, even though absolute inventory remains below 2019 levels. The rise partly reflects weaker sales rather than more listings, because the ratio divides unadjusted inventory by seasonally adjusted sales. Distressed sales are only 2% of transactions, which limits forced selling. [1] [2]
transaction volume is at a 16-year low, and September's pending-sales drop points to soft near-term closings.
Read the full assessment
Implication: brokers, lenders and title firms face continued volume pressure, while 5.1 months of supply may shift negotiating leverage toward buyers.
Executive brief
US existing-home sales fell to a 3.75 million seasonally adjusted annual rate (SAAR) in October 2026. That is the slowest pace since August 2010. The figure is down 5.5% from September and 8.8% from a year earlier (NAR). Prices held up anyway: the median sale price was $416,700, up 0.4% from a year earlier. Months of supply reached 5.1, compared with 3.9 in October 2019 (CalculatedRisk). NAR, which publishes the data, blames 30-year mortgage rates averaging 7.33% in October, up from 6.25% a year earlier. Other economists also point to uncertainty before the election.
What changed and event timeline
Rates trough
The 30-year rate hit a low of 5.98%. It then climbed after geopolitical tensions raised oil prices and inflation worries, according to.
Rates peak near 7.40%
Freddie Mac's weekly 30-year average reached 7.40%. It eased to 7.32% the following week ().
Contract signings drop
NAR's Pending Home Sales Index fell 7.3% in September to 66.0, down 11.3% from a year earlier. NAR said rates were "fast-rising" (). Pending sales measure signed contracts, which usually close one to two months later.
Slight rate relief
The 30-year average dipped to 7.24%, compared with 6.17% a year earlier. The 10-year Treasury yield eased to 4.98% after topping 5.30% earlier in the month ().
October sales at a new cycle low
Sales fell to a 3.75M SAAR, the lowest since August 2010 (;).
Capabilities and access
This section covers the data release rather than a product. All figures are from NAR's October report, released Nov 12, 2026.
Read the full section
This section covers the data release rather than a product. All figures are from NAR's October report, released Nov 12, 2026.
- Single-family homes: 3.41M SAAR (−5.8% month over month); median price $421,900.
- Condos and co-ops: 340k (−10.5% year over year); median price $365,100.
- By region, year over year: West −14.5% (650k); Midwest −8.2%; South −8.0%; Northeast −4.1%.
- Buyer mix: 29% first-time buyers, 29% all-cash, 20% investors or second-home buyers, 2% distressed sales.
- Days on market: 35, up from 33.
Technical analysis for researchers and developers
- Sales are seasonally adjusted. Year-over-year comparison is the cleaner read: inventory is up 4.6% (CalculatedRisk).
- It divides unadjusted inventory by adjusted sales, so a rise from 4.7 to 5.1 partly reflects weaker sales rather than more listings.
- September inventory was revised down to 1.57M.
Read the full section
- Seasonal adjustment differs by series. Sales are seasonally adjusted. Headline inventory (1.59M) is not, and it usually peaks in summer and bottoms in December–January. Year-over-year comparison is the cleaner read: inventory is up 4.6% (CalculatedRisk).
- Months of supply mixes the two. It divides unadjusted inventory by adjusted sales, so a rise from 4.7 to 5.1 partly reflects weaker sales rather than more listings.
- Revisions. September inventory was revised down to 1.57M.
- Median prices depend on what sells. The median shifts with the mix of homes sold, so it is not a repeat-sales price index.
Claims and evidence
- Sales level and changes: Primary NAR data (NAR).
- "Lowest since August 2010," when sales were 3.68M: From NAR's economist, repeated by RISMedia and HousingWire.
- Prices are flat to rising: This is NAR's median, which contradicts other data.
Read the full section
- Sales level and changes: Primary NAR data (NAR).
- "Lowest since August 2010," when sales were 3.68M: From NAR's economist, repeated by RISMedia and HousingWire.
- Prices are flat to rising: This is NAR's median, which contradicts other data. HousingWire's weekly data shows the single-family median down 3.2% to $400,000 (HousingWire), so price direction is contested.
- Rates are the main cause: NAR's Lawrence Yun says so. Realtor.com's Danielle Hale adds uncertainty before the election (RISMedia).
Context and prior work
Read the full section
- Sales have been very low for roughly four years. Even though absolute inventory is still below 2019 levels, supply has outgrown demand on a months-of-supply basis (CalculatedRisk).
- September's drop in pending sales foreshadowed October's closings (NAR).
- Rising rates since February added about $350 a month to the payment on a $400,000 loan (News4JAX).
Limitations, safety and contested findings
- Price direction is disputed. NAR shows +0.4%; HousingWire's weekly data shows −3.2%. The two use different methods.
- More weakness may still be coming.
- "Pent-up demand" is an opinion. Yun's view that sales will rebound when rates fall is attributed to NAR, not measured (RISMedia).
Read the full section
- Price direction is disputed. NAR shows +0.4%; HousingWire's weekly data shows −3.2%. The two use different methods.
- More weakness may still be coming. Zonda's Sean Fergus expects November and December closings to reflect buyers pulling back when rates hit about 7.4% in mid-October (HousingWire).
- "Pent-up demand" is an opinion. Yun's view that sales will rebound when rates fall is attributed to NAR, not measured (RISMedia).
- Commentary is paywalled. Most of CalculatedRisk's analysis is for paid subscribers only.
Business and practitioner implications
- Brokerages, mortgage lenders and title firms: Transaction volume is at its lowest in 16 years, and pending sales point to soft closings in the near term.
- Sellers and builders: Supply of 5.1 months and longer days on market shift negotiating power toward buyers.
- Analysts and data teams: Separate sales from prices. Volume is collapsing, but distressed sales are only 2%, which limits forced selling.
Read the full section
- Brokerages, mortgage lenders and title firms: Transaction volume is at its lowest in 16 years, and pending sales point to soft closings in the near term.
- Sellers and builders: Supply of 5.1 months and longer days on market shift negotiating power toward buyers. The price data conflict, though.
- Analysts and data teams: Separate sales from prices. Volume is collapsing, but distressed sales are only 2%, which limits forced selling. Hale ties the outlook to inflation, growth and the capital demands of AI investment (RISMedia).
- None of this is investment advice.