
AgentsAutonomy & tool use
Microsoft Research releases Flint 1.0, letting AI agents build interactive charts in a high-level language
Flint 1.0 lets AI agents add clicks, brushing, zoom and linked tables to charts by mapping compiler-generated semantic events, such as a selected country, to high-level update operators instead of writing low-level rendering code.
From the Microsoft Research article of October 22, 2026 and cited sources: Flint's compiler handles the visual work. [1] [2]
SOURCES[1] Flint-interactive (MSR blog, Oct 22, 2026) microsoft.com[2] Linked video: Flint-interactive: A language for creating… youtube.com
 AT Pulse research deskPublished · Updated · 5 min read · AI-assisted analysis
AI-assisted, not human-edited. Methodology Corrections Who owns this site
- Original source
- Microsoft Research article, company source
- Brief by
- AT Pulse research desk AI-assisted; publisher and contact on the desk page
- Studies
- arXiv 2607.20775 (Jul 2026) [5] date from arXiv ID
- When
- October 22, 2026 article published
- Covered
- Oct 23 edition
- Evidence
- 8 sources across 6 sites
- 1Flint-interactive (MSR blog, Oct 22, 2026)microsoft.com
- 2Linked video: Flint-interactive: A language for creating…youtube.com
- 3microsoft/flint-chart releasesgithub.com
- 4Flint: A visualization language for the AI era…microsoft.com
- 5Flint: A Semantics-Driven Data Visualization Intermediate…arxiv.org
- 6microsoft/flint-chart READMEgithub.com
QuietHow it’s measured
YouTube video · 87 views · 1 like
Reach blends public engagement (views, likes, comments, shares, stars) from the platforms where the story or its original source lives: YouTube, Hacker News, GitHub, Substack and similar. A video and the article written from its transcript share one score, taken from the video. Platforms with no data are left out rather than counted as zero, and the age of a story never lowers its score.
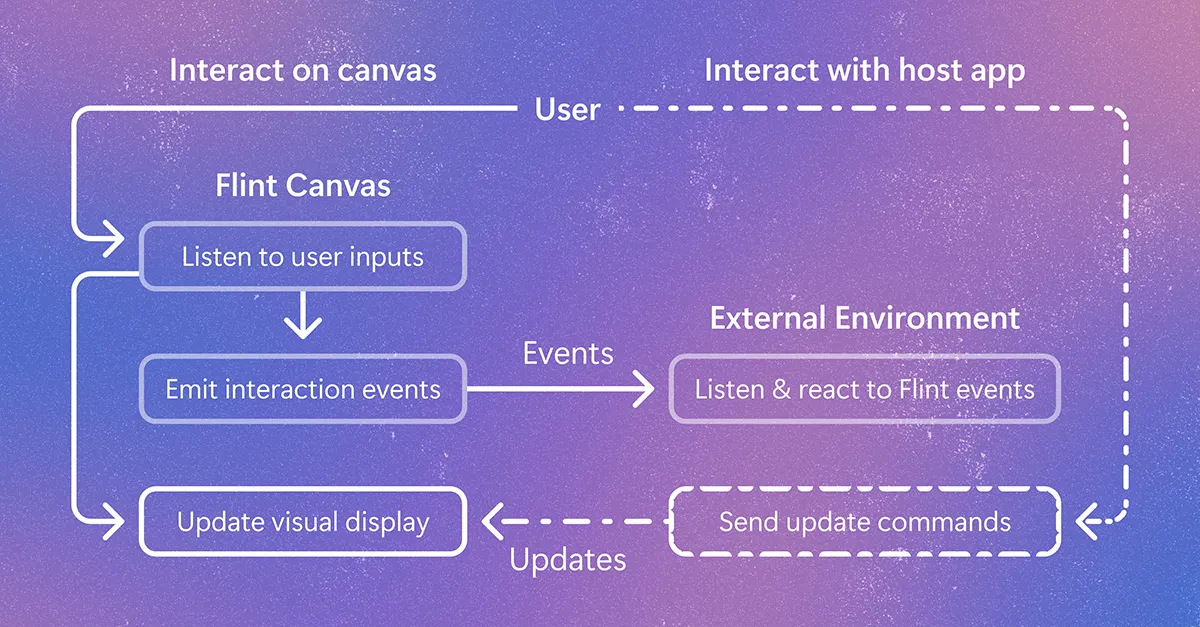
Flint's compiler handles the visual work. It does the hit testing and turns raw clicks, drags and key presses into events that refer to the data, such as a country name instead of an SVG path. The author or agent then only maps those events to operators like highlight, annotate, pan and zoom. A runtime called Flint Canvas tracks interaction and rendering state. [1] [2]
Flint 1.0 is MIT-licensed and installs from npm, with an MCP server for chat use. It has 23 interaction presets that work on Vega-Lite, ECharts, Chart.js and Plotly. There are three ways to use it: interaction specs written in chat, event handlers that connect charts to tables and app state, and custom trigger-plus-handler code. All three are packaged as agent skills. [2] [3] [6]
Version 1.0 splits a chart into three separate parts: the chart spec, the theme and the interactions. Each part can change without touching the other two, so a layout or style change does not break the interaction logic. [2]
The release adds interaction support across four chart renderers. If it works as described, teams building agentic analytics could get linked, clickable charts without maintaining custom D3 or SVG code.
Read the full assessment
No published tests yet measure agent success rates or token costs.
Executive brief
Microsoft Research has extended Flint, its open-source chart language for AI agents, so that agents can build charts people can click, brush, zoom and link to tables and text. An agent no longer has to write low-level rendering code for this. Flint's compiler turns raw clicks and drags into "semantic events" that refer to the data (for example, "Japan" rather than an SVG path), and the agent maps those events to high-level update operators (MSR blog). The feature shipped as Flint 1.0 under the MIT license. It has 23 interaction presets. Microsoft says it makes interactive charts more reliable and cheaper to generate, but no published benchmark measures either claim.
What changed and event timeline
First public release
Version 0.1.1 introduced the Flint language, a TypeScript library and an MCP server ().
Flint announced
Microsoft presented Flint as a semantic-type chart language that compiles to Vega-Lite, ECharts and Chart.js, and reported small LLM-generation gains over writing Vega-Lite directly ().
Paper on arXiv
The paper describes a hierarchical data-semantic model and a multi-backend compiler. It covers static chart authoring, not the new interaction layer ().
Themes added
Version 0.5 introduced ThemeSpec, which applies design systems such as Economist- and McKinsey-style presets across chart libraries ().
Flint 1.0 ships with interactions
The release page dates it October 21 and the README says October 19. Features include linked brushing, annotations, semantic zoom and coordinated chart–table views (;).
Flint-interactive blog
Microsoft Research explained the design: semantic events, update operators and the Flint Canvas runtime ().
Capabilities and access
- Packages: Flint 1.0, installed with
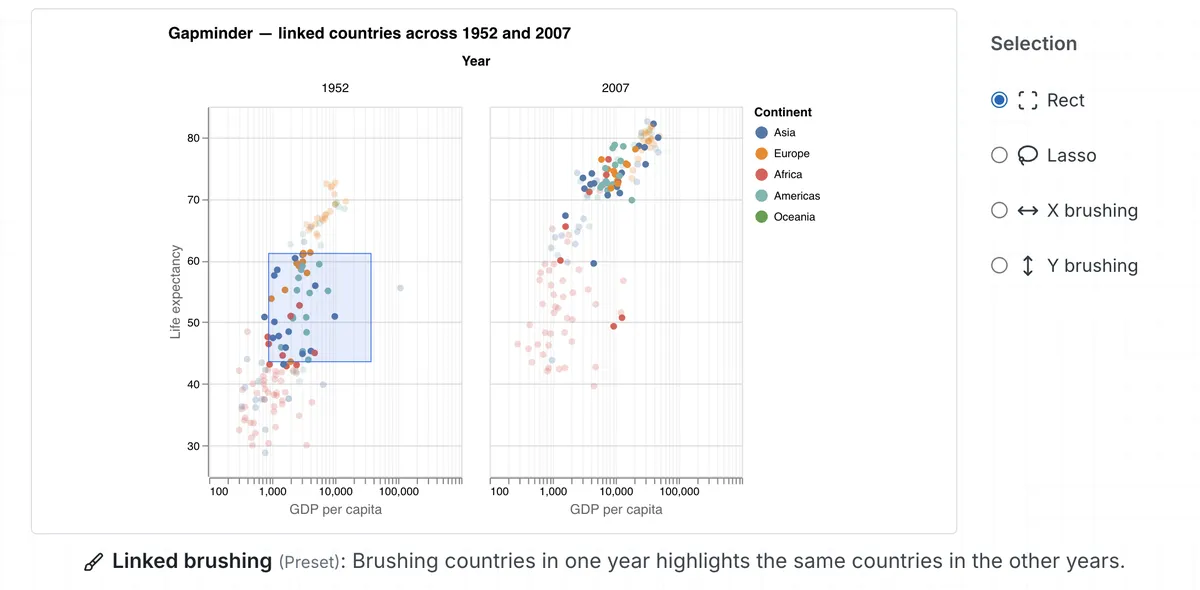
npm install flint-chart, plus theflint-chart-mcpserver for chat and MCP Apps. - Interaction support: 23 presets, including highlight, select, lasso, brush and keyboard navigation (video 01:00). Interactions work on the Vega-Lite, ECharts, Chart.js and Plotly backends (README).
- Three ways to use it:
Read the full section
- Packages: Flint 1.0, installed with
npm install flint-chart, plus theflint-chart-mcpserver for chat and MCP Apps. A Python port is in preview (README). - Interaction support: 23 presets, including highlight, select, lasso, brush and keyboard navigation (video 01:00). Interactions work on the Vega-Lite, ECharts, Chart.js and Plotly backends (README).
- Three ways to use it:
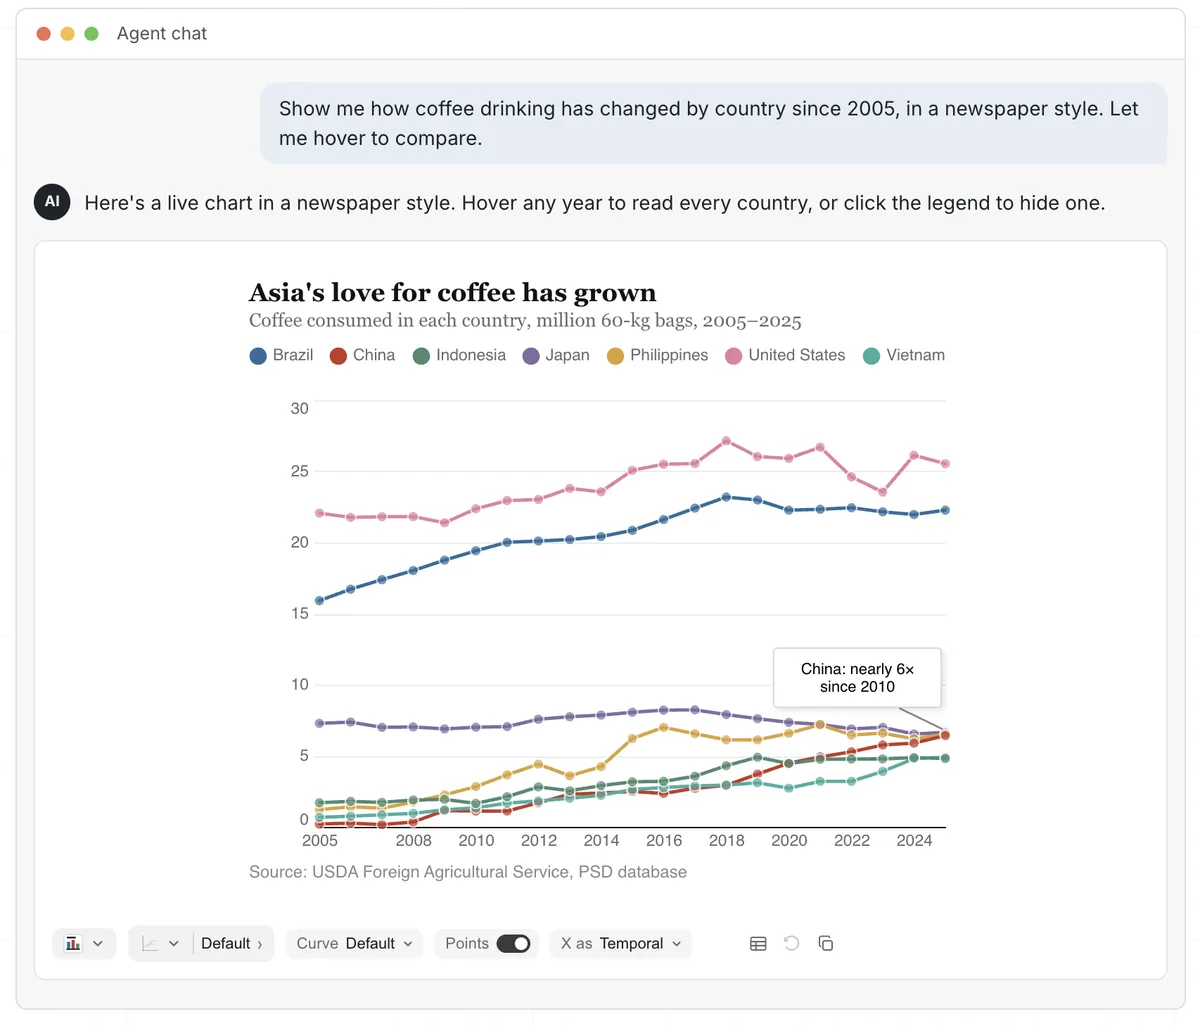
- In chat: the agent writes an
interaction_specnext to the chart spec. - In apps: event handlers and update operators connect charts to the rest of the page.
- Custom: a trigger plus a handler function builds bespoke interactions.
- Agent skills: all three modes are packaged as agent skills (video 02:04).
Technical analysis for researchers and developers
- Split of responsibilities: the compiler owns the visual logic. The author only writes the interaction logic (MSR blog).
- Runtime: Flint Canvas is a state machine that tracks interaction state and rendering state.
- App integration: callbacks receive a
phaseand astate, so an app can, for example, filter a table on commit (README).
Read the full section
- Split of responsibilities: the compiler owns the visual logic. It handles hit testing, turns raw triggers into semantic events, and turns operators such as set-style, set-annotation and set-viewport into canvas changes. The author only writes the interaction logic (MSR blog).
- Runtime: Flint Canvas is a state machine that tracks interaction state and rendering state.
- App integration: callbacks receive a
phaseand astate, so an app can, for example, filter a table on commit (README). - Three independent parts in 1.0: the chart spec, the theme and the interactions can each change without touching the other two (video 02:20).
- Reproducibility: the code is open, but no evaluation of the interaction layer has been published.
Claims and evidence
- Simplicity: "Two lines of code" for highlight plus zoom (video 00:00). This is a demo claim, not a measurement.
- Reliability and cost: Microsoft says the approach lowers generation cost and makes interactions more reliable (MSR blog; video 02:37).
- Static-chart quality: the earlier evaluation, also vendor-run, reported small gains over direct Vega-Lite generation. That study does not cover interactions.
Read the full section
- Simplicity: "Two lines of code" for highlight plus zoom (video 00:00). This is a demo claim, not a measurement.
- Reliability and cost: Microsoft says the approach lowers generation cost and makes interactions more reliable (MSR blog; video 02:37). It publishes no token, latency or error-rate numbers. These are vendor statements, and no independent check exists.
- Static-chart quality: the earlier evaluation, also vendor-run, reported small gains over direct Vega-Lite generation. For example, GPT-5.1 scored 16.27 with Flint vs. 15.91 without (MSR Flint blog). That study does not cover interactions.
Context and prior work
- Same team, same approach: Flint comes from Chenglong Wang's group, which also built Data Formulator, now powered by Flint (MSR Flint blog).
- Academic collaborators: the paper includes authors from Renmin University's IDEAS Lab (arXiv), and the interactive work adds UCLA and Power BI contributors.
- What it builds on: it extends Vega-Lite-style declarative grammars to interaction, and its custom-handler example reproduces DimpVis-style drag-along-trajectory exploration (MSR blog).
Read the full section
- Same team, same approach: Flint comes from Chenglong Wang's group, which also built Data Formulator, now powered by Flint (MSR Flint blog).
- Academic collaborators: the paper includes authors from Renmin University's IDEAS Lab (arXiv), and the interactive work adds UCLA and Power BI contributors.
- What it builds on: it extends Vega-Lite-style declarative grammars to interaction, and its custom-handler example reproduces DimpVis-style drag-along-trajectory exploration (MSR blog).
- Independent coverage: a July walkthrough by Better Stack covers only the static release. No independent coverage of Flint-interactive has appeared.
Limitations, safety and contested findings
- No evaluation of the interactive layer. Neither the reliability nor the cost claims are quantified.
- Gaps noted in July: Better Stack listed no maps, 3D, network graphs or complex layering, plus weak handling of high-cardinality data.
- Documentation inconsistencies:
Read the full section
- No evaluation of the interactive layer. Neither the reliability nor the cost claims are quantified.
- Gaps noted in July: Better Stack listed no maps, 3D, network graphs or complex layering, plus weak handling of high-cardinality data. It also said accessibility features were unreleased (Better Stack). Flint 1.0 now advertises keyboard navigation (video 01:08), but no source has checked it.
- Documentation inconsistencies:
- The 1.0 release date differs between the README and the releases page.
- The blog's "Flint Canvas" runtime is not named in the README.
- Project status: Microsoft calls Flint early-stage research software (startuphub.ai).
Business and practitioner implications
- Who it helps: teams building agentic analytics or reporting can get interactive charts in chat through MCP, and two-way chart–table filtering in dashboards, without maintaining custom D3 or SVG code.
- Lock-in: the code is MIT-licensed and works across several backends, which limits renderer lock-in, but it ties teams to Flint's spec format.
- Language support: TypeScript only for now, with Python in preview.
Read the full section
- Who it helps: teams building agentic analytics or reporting can get interactive charts in chat through MCP, and two-way chart–table filtering in dashboards, without maintaining custom D3 or SVG code.
- Lock-in: the code is MIT-licensed and works across several backends, which limits renderer lock-in, but it ties teams to Flint's spec format.
- Language support: TypeScript only for now, with Python in preview.
- Before adopting: since no independent benchmark exists, test agent success rates, token use and accessibility on your own data.
The source trail.
Sources (8)
Flint-interactive (MSR blog, Oct 22, 2026)
microsoft.comLinked video: Flint-interactive: A language for creating interactive data visualizations
linked video auto captions
www.youtube.com